“The Role of Manufactured Housing in Increasing the Supply of Affordable Housing” is a research report published by the Urban Institute and authored by Karan Kaul and Daniel Pang. It is a sad reality that manufactured housing is widely misunderstood. Impressions about manufactured housing are often driven by old and outdated stereotypes. To address this lack of factual and evidence-based understanding, Mobile Home and Manufactured Home Living News (MHLivingNews) has for years presented information from third-party researchers. Among those have been prior Urban Institute (UI) research on manufactured homes. With certain caveats, which will be noted further below following their report, UI research is routinely informative. One teaser. To boil their extensive research down, Kaul and Pang have provided fresh evidence that manufactured housing is a good value, is significantly safer than most may think, and the bulk of their findings mirror those previously published by MHLivingNews and MHProNews that are produced by other third-party researchers and/or our own analysis of the facts and evidence available. Before diving into their report, which will be followed by additional information, analysis, and commentary by MHLivingNews, some self-described background on UI is warranted.
ABOUT THE URBAN INSTITUTE
The Urban Institute is a nonprofit research organization that provides data and evidence to help advance upward mobility and equity. We are a trusted source for changemakers who seek to strengthen decision making, create inclusive economic growth, and improve the well-being of families and communities. For more than 50 years, Urban has delivered facts that inspire solutions—and this remains our charge today.
Additionally, UI said the following:
 Acknowledgments
This report was funded by Cascade Financial Services. We are grateful to them and to all our funders, who make it possible for Urban to advance its mission.”
Note that Cascade is a Manufactured Housing Institute (MHI) member firm. The UI authors also said this:
The views expressed are those of the authors and should not be attributed to the Urban Institute, its trustees, or its funders. Funders do not determine research findings or the insights and recommendations of Urban experts. Further information on the Urban Institute’s funding principles is available at urban.org/fundingprinciples.
We would also like to thank our Urban Institute colleague Laurie Goodman, Institute fellow in the Housing Finance Policy Center, for her invaluable advice.”
The above is an interesting disclosure, and it will be addressed further below in our MHLivingNews remarks segment of this report. Note for now that highlighting in the text that follows is provided by MHLivingNews. The actual text of the UI authors is otherwise unchanged.
With that backdrop, here is the complete UI report linked here, but the text of their report is as follows.
The Role of Manufactured Housing in Increasing the Supply of Affordable Housing
Karan Kaul Daniel Pang
July 2022
Copyright © July 2022. Urban Institute. Permission is granted for reproduction of this file, with attribution to the Urban Institute. Cover photo via Shutterstock.
Contents
The Role of Manufactured Housing 1
Quantifying the Housing Supply Shortage 2
Manufactured Housing Can Be Part of the Solution to the Supply Problem 3
Improved Access to Financing Can Boost Demand for Manufactured Housing 12
How Many Manufactured Housing Units Could We Add to the Housing Supply? 19
The Role of Manufactured Housing
The US housing market is facing a shortage of millions of homes, an outcome that has pushed homes out of reach for most low- and middle-income households. The housing supply shortage encompasses single-family homes and multifamily properties and owner-occupied and rental housing. There is no single reason new housing production remains low. Broadly speaking, the supply shortage has five main causes: local and state zoning restrictions that favor detached single-family construction1; stringent building codes that increase construction costs; chronic labor shortages in the construction sector; the high costs of building materials; and financing difficulties for affordable options, such as manufactured homes, accessory dwelling units, and home preservation. These issues are deeply structural and multipronged, making it difficult to identify and develop centralized solutions that apply nationwide (Kaul, Goodman, and Neal 2021).
Because manufactured housing is inherently low-cost housing, it could be a part of the solution to the affordability crisis. Manufactured homes cost significantly less than site-built housing, and the quality and appeal of manufactured homes built to US Department of Housing and Urban Development (HUD) standards has improved drastically. Yet, annual shipments of manufactured homes remain low by historical standards. In this report, we discuss the role of manufactured housing in prior decades, describe its current state, and outline the role it can play in alleviating the supply shortage. We begin by quantifying the nationwide supply crisis and discuss some of the actions taken so far. We then explain key reasons manufactured housing can be a part of the solution, specifically discussing product quality improvements, shifts in consumer attitudes toward and rising demand for manufactured housing, increased production capacity, and better affordability relative to site-built homes.
Financing difficulty for affordable options such as manufactured homes, preservation, and accessory dwelling units is well documented, but financing’s role in exacerbating the supply crisis is often underappreciated (Goodman, Kaul, and Neal 2022). In this report, we discuss financing barriers that adversely affect credit availability for manufactured homes and provide recommendations to improve access to credit, especially for chattel lending. We propose that the government-sponsored enterprises (GSEs) explore pilot programs to acquire chattel loans and lay off credit risk to private investors. We also offer suggestions to improve existing GSE and Federal Housing Administration (FHA) manufactured home lending programs by streamlining the process and reducing costs. Toward the end of the report, we provide a high-level estimate of how many additional units of manufactured housing could be added to the housing stock in the coming years, quantifying the role it can play in easing the supply crisis.
Quantifying the Housing Supply Shortage
Several studies have quantified the housing supply shortage. Khater, Kiefer, and Yanamandra (2021) estimate the supply shortage by assuming every household needs a place to live and some level of vacancy is necessary in a well-functioning housing market. They construct a target number of households and a target vacancy rate and estimate that it would take 3.8 million additional housing units to meet current demand. The National Association of Realtors estimates that a slower annual pace of residential completions from 2001 to 2020 relative to the annual pace from 1968 to 2000 has resulted in at least 5.5 million fewer units being built from 2001 to 2020 (Rosen et al. 2021).
A third way to quantify the shortage is to look at population-adjusted housing construction: single family units plus multifamily units plus manufactured housing built per 1,000 people. In 2021, population-adjusted housing construction stood at 5.1 units per 1,000 people (1.69 million units produced, 331 million estimated population) (figure 1). Although this number is up from the level just after the financial crisis, it is considerably lower than the 7.8 units, on average, from 1959 to 2006. Figure 1 also shows that single-family units (one-to-four-family units) and manufactured home shipments are recovering slowly and running well below historical levels. Multifamily units, though lower than in the 1960s, 1970s, and early 1980s, are close to their highest level since the passage of the 1986 Tax Act, which eliminated some of the favorable tax breaks for investment properties.
FIGURE 1
Housing Production per 1,000 People

URBAN INSTITUTE
Source: Urban Institute calculations of US Census Bureau data.
The obvious solution to the supply crisis is to build more single-family, multifamily, and manufactured housing. More multifamily construction would be the most efficient way to alleviate shortages in urban areas close to employment and transit centers, where land is scarce and the affordability crisis particularly acute. But more multifamily construction needs to be accompanied by increasing the density of new single-family units and pivoting to lower-cost alternatives to site-built housing, such as manufactured homes. This is likely to work better in suburban areas and towns with more buildable land. During the COVID-19 pandemic, even smaller cities, towns, and rural areas have experienced rapid home price increases and dwindling inventory levels because of out-migration from large cities.
Manufactured homes can also mitigate the impact of the aging housing stock. More than half the US housing stock of 140 million units is more than 42 years old, and more than a quarter is more than 62 years old. Although home preservation plays a crucial role in extending useful life, manufactured homes could be a viable solution for very old or unsafe homes that are uneconomical to repair. Jurisdictions with a large stock of such homes could improve housing quality for their residents through zoning reforms that permit manufactured housing.
Steps have been taken to address some of these issues, such as restrictive zoning regulations.2 Other issues, such as the high costs of materials and the construction labor shortage, are rooted in the structure of the economy and are dictated by market forces. The Biden administration has unveiled plans that the White House estimates would create or preserve 100,000 units over the next three years3 and help close the housing supply shortfall in five years.4 Among other actions, these plans call for supporting the permitting, production, and financing of manufactured housing.
Manufactured Housing Can Be Part of the Solution to the Supply Problem
Figure 2 shows that between 1977 and 1993, the number of manufactured housing units shipped fluctuated between 200,000 and 300,000, averaging 240,000 units per year. From 1994 to 2000, the number of manufactured housing units increased to more than 300,000 per year, an unsustainable level caused by overproduction and loosening financing standards, which resulted in credit being extended to borrowers who could not afford the homes.
FIGURE 2
Annual Shipments of Manufactured Homes
Thousands of units shipped Share of single-family production
1975 1984 1993 2002 2011 2020 1975 1984 1993 2002 2011 2020

URBAN INSTITUTE
Sources: US Census Bureau and US Department of Housing and Urban Development.
As foreclosures and repossessions increased in 1999, new and used manufactured housing units flooded the market. Tighter credit standards for new borrowers further decreased demand, and production crashed, decreasing to an average of 170,000 units per year from 2000 to 2005. The decline in shipments was followed by the nationwide housing bubble and the Great Recession. Shipments continued to decline, reaching a low of about 50,000 units per year from 2009 to 2012, followed by a gradual recovery. In 2021, nearly 106,000 units shipped, double the 2009–12 level. And 2022 has started off strong: January to April shipments are 12 percent higher compared with same period in 2021. Despite these increases, manufactured home shipments as a share of new single-family production remains low. This share ranged from 15 percent to 27 percent between 1977 and 1995 but has averaged only about 9 percent in the past decade.
The number of manufactured homes being shipped remains low because of zoning and financing constraints. Zoning constraints affect manufactured homes that are in communities and those on privately owned land (often owned by the person who owns the manufactured home or a family member). In many jurisdictions, zoning regulations outright ban manufactured housing, whether in manufactured housing communities or on privately owned lots. According to a recent Freddie Mac report, more than a million people living in jurisdictions with stringent manufactured housing zoning regulations are mortgage ready and would be able to achieve homeownership if zoning were less stringent (Aw, Brown, and Yea, n.d.). Even when permitted, manufactured homes often face additional restrictions, such as minimum lot sizes in excess of what is required for site-built homes or special permitting, adding costs and delays and effectively prohibiting their use. As a result, it has become difficult to build new manufactured housing communities (few have been built since 2000) or, in many localities, even install a new manufactured housing unit on a privately owned lot.
Consumer Demand for Manufactured Housing Is Rising
The steady increase in the number of manufactured housing units shipped since 2010 indicates that demand for manufactured housing remains healthy. Further, as prices for site-built homes rise beyond what middle-income families can afford, manufactured housing could play an increasingly larger role in the market. As discussed later, the quality of newly built manufactured homes has improved substantially, owing to HUD code updates and the industry’s focus on improving quality.
The 106,000 units shipped in 2021 represented a 12 percent increase from 2020 (94,000 units). Per filings of publicly traded manufactured home builders, the industry experienced strong demand growth in 2021 but could not keep production up (table 1). As a result, the industry had a substantial order backlog at the end of 2021. From these public filings, we estimate that the total industry-wide backlog was 47,400 units at the end of 2021.
TABLE 1
Estimated Manufactured Housing Unit Backlog as of December 2021
| Market share in 2021 | Units shipped in 2021 | Backlog, as of year-end 2021 | Estimated unit backlog | |
| Cavco Industries | 14.0% | 14,800 | $1.1 billion | 10,200 |
| Clayton Homes | 47.3% | 50,000 | $1.4 billion | 13,000 |
| Skyline Homes | 17.0% | 18,000 | $1.5 billion | 13,900 |
| Others | 21.7% | 23,000 | $1.1 billion | 10,300 |
| Total | 100.0% | 105,800 | $5.1 billion | 47,400 |
Source: Urban Institute estimates based on public company filings and US Census Bureau data.
To keep up with rising demand, builders have added new capacity. In 2011, 122 plants produced manufactured homes; as of January 2022, the number had increased to 140 plants, according to data from the Manufactured Housing Institute (figure 3). More factories are coming online in the coming months as builders try to work through backlog and cater to higher demand.5
FIGURE 3
1992 1996 2000 2004 2008 2012 2016 2020

URBAN INSTITUTE
Sources: Manufactured Housing Institute and the Institute for Building Technology and Safety.
The Quality of Manufactured Housing Has Improved Substantially
In the past, manufactured housing was more susceptible to damage from natural disasters. Over time, the HUD Code has mandated changes that make modern manufactured homes significantly more resilient to fire and natural disasters than pre-HUD-Code housing. Before 1977, manufactured housing was unregulated at the federal level. HUD implemented the first federal construction standards for all manufactured homes produced after June 15, 1976, as mandated by the 1974 Manufactured Housing Construction and Safety Standards Act (1974 Act). The act granted HUD the authority to establish a single federal construction standard that preempts state and local codes.6 These requirements regulate energy efficiency, durability, fire safety, transportability, and material and construction quality. Establishing a uniform code and standards ensured a minimum level of quality and allowed for more standardization, decreasing manufacturing costs.
The improved standards after 1976 also helped distinguish between the terms “mobile homes” and “manufactured homes,” which were often used interchangeably before the HUD Code. The Housing Act of 1980 mandated the term “manufactured” be used in place of “mobile” in all federal laws and literature that referenced homes built after 1976. The term “mobile home” often carried stigma surrounding product quality, as homes built in 1976 or earlier often resembled campers or trailers that could be easily moved if needed. In contrast, “manufactured homes” built after 1976 saw major improvements in design, quality of material, and construction standards inside climate-controlled building facilities. These upgraded standards allowed the sizes of these homes to expand significantly as homebuyers were given the option to choose between single-section, double-section, and triple-section designs, with larger homes more likely to be placed on a permanent foundation similar to their site-built counterparts.
The damage caused by natural disasters, including Hurricane Hugo in 1989, Hurricane Andrew in 1992, and the Northridge earthquake in 1994, prompted HUD to collect more data on how disasters affect manufactured housing. After conducting additional studies on wind safety, construction methods, anchoring systems, condensation control, and energy conservation, HUD updated its code in 1994 to improve disaster resiliency. The Manufactured Housing Improvement Act of 2000 resulted in further quality improvements (Committee on Banking 2000). The act gave HUD the authority to establish installation standards that would become nationwide minimum standards.7 These standards apply to work performed on site, such as foundation, anchorage, close-up work, and postplacement connections of appliances and utility systems. These standards complemented the construction and safety standards established by the 1974 Act that must be met before the home is shipped from the production facility.
Manufacturers are required to self-certify that their manufactured homes conform with the federal Manufactured Home Construction and Safety Standards established by the 1974 Act.
Damage assessments of homes affected by Hurricane Charley in 2004 concluded that manufactured homes built to the 1994 standards performed significantly better than homes built before 1994 (Goswami 2005). Research also shows that when anchored properly, manufactured homes built after 1994 were at least as safe as site-built homes during tornadoes and hurricanes. Quality improvements in construction and installation practices have increased durability so that the life expectancy of factory-built housing is increasingly comparable with that of site-built housing.8
American Housing Survey (AHS) data provide strong empirical evidence that manufactured housing quality has improved. Manufactured homes built after the 1974 and 1994 code updates were built to increasingly higher standards compared with homes built in previous periods. Table 2 shows the share of manufactured and site-built homes built in a given period that were classified “inadequate” in the next decade. This allows us to control for home age. The homes’ conditions are defined by the AHS physical adequacy rating, which considers more than 14 criteria, including plumbing and water facilities, electric and heating equipment, and structural conditions. The inadequacy share is the ratio of the number of homes classified inadequate to the number homes built in the period.
Of the manufactured homes built between 1970 and 1979, 9.3 percent were classified inadequate by the American Housing Survey in 1989. This share dropped substantially to 4.2 percent for homes built between 1980 and 1989 and surveyed in 1999, likely reflecting the full impact of the 1976 code improvements. The subsequent two periods show continued quality improvement, with the inadequacy ratio falling to 2.4 percent for homes built between 1990 and 1999 and to 2.2 percent for homes built between 2000 and 2004 and surveyed in 2013.9 While the inadequacy share for site-built homes has also come down, the gap between the two has narrowed significantly.
TABLE 2
Inadequate Homes
Manufactured versus site-built housing
| Period home was built | AHS survey year | Share of manufactured homes deemed inadequate | Share of site-built homes deemed inadequate |
| 1970–79 | 1989 | 9.3% | 6.6% |
| 1980–89 | 1999 | 4.2% | 3.7% |
| 1990–99 | 2009 | 2.4% | 2.5% |
| 2000–04 | 2013 | 2.2% | 1.5% |
Source: 1989–2013 American Housing Survey (AHS) data.
In terms of energy efficiency, around 25.6 percent of manufactured homes shipped in 2021 were Energy Star certified, according to Manufactured Housing Institute data. Energy Star–certified manufactured homes are designed, manufactured, and installed to meet energy efficiency requirements set by the US Environmental Protection Agency.10 The energy-efficient features of these homes help lower utility bills. Only 7.9 percent of single-family site-built homes completed in 2020 were Energy Star certified. A major reason manufactured homes consume less energy than site-built homes is because they are smaller. Recently finalized changes to federal energy efficiency standards could make manufactured homes even more energy efficient. In May 2022, the US Department of Energy adopted11 a new tiered approach where lower-cost homes would be subject to less stringent efficiency standards to keep prices relatively affordable.
Manufactured Housing Is More Affordable Than Site-Built Housing
Manufactured housing is one of the most affordable types of housing available (table 3). The average sales price for manufactured homes in 2021 was $108,100, excluding land, according to the US Census Bureau’s Survey of Construction and its Manufactured Housing Survey. As of January 2022, the average sales price had increased to $122,500, reflecting strong consumer demand, high inflation, and continued labor shortages. In comparison, the average price of new site-built homes in 2021, excluding land, was $365,900.12 In 2021, the average size of newly constructed site-built homes was 2,544 square feet compared with 1,497 square feet for newly built manufactured homes.
Controlling for size, prices of manufactured homes are half the prices of their site-built counterparts, on average. In 2021, the average price, excluding land, per square foot for site-built homes was $144 compared with only $72 for manufactured homes. The difference can be attributed largely to factory-built construction, which is less labor intensive and more automated. Factory-built construction is also less prone to weather-related delays and waste, which speeds up the process and reduces costs.
The affordability advantage of manufactured housing creates opportunities for households with low incomes to become homeowners. In 2021, the median income for manufactured home buyers stood at $57,000 compared with $93,000 for site-built borrowers, according to Home Mortgage Disclosure Act data. More than 70 percent of manufactured home borrowers had annual incomes under $75,000 in 2021 compared with only 36 percent of borrowers who purchased site-built homes in 2021.
TABLE 3
Key Single-Family Housing Characteristics, by Construction Method, 2021
| Manufactured homes | Site-built homes | |
| Average sales price, excluding land | $108,100 | $365,900 |
| Average square footage | 1,497 | 2,544 |
| Average price per square foot | $72 | $144 |
| Median homebuyer income | $57,000 | $93,000 |
| Number of units completed | 105,800 | 970,000 |
Sources: 2021 US Census Bureau Survey of Construction, 2021 US Census Bureau Manufactured Housing Survey, and 2021 Home Mortgage Disclosure Act data.
The share of newly built site-built homes that is affordable has declined sharply since 2014 (table 4). The share of new site-built homes priced under $250,000 (excluding land value) stood at 58.0 percent in 2014. By 2021, this share had fallen to 25.3 percent. The market for new site-built homes priced below $125,000 was nonexistent in 2021, while the market for homes priced between $125,000 and $249,000 has shrunk considerably since 2014. For low-income households looking to buy homes priced under $250,000, the site-built market offers limited opportunity.
TABLE 4
Sales Price Distribution of New Site-Built Homes, Excluding Land
- 3% 51.7% 42.0%
- 5% 51.1% 44.4%
- 2% 49.2% 47.7%
- 0% 45.3% 52.7%
- 5% 42.7% 54.8%
- 5% 44.9% 53.6%
- 6% 41.8% 57.6%
TABLE 5
Sales Price Distribution of New Manufactured Homes, Excluding Land
- 9% 4.0% 0.0%
- 4% 4.6% 0.0%
- 7% 5.3% 0.1%
- 8% 4.8% 0.4%
- 2% 8.7% 0.1%
- 4% 11.4% 0.2%
- 5% 14.5% 0.1%
The manufactured housing market has also seen significant price increases, given rising labor and materials costs, as well as strong demand and high inflation during the pandemic. Despite this, the share of new manufactured homes priced below $125,000 was 67.3 percent of new units shipped in 2021 (table 5). Note that the share of manufactured homes priced between $125,000 and $249,999 has jumped from 4.0 percent in 2014 to 32.1 percent in 2021. This suggests that manufactured housing has the potential to serve the needs of households priced out of site-built housing. As affordability pressures intensify further, we would expect the share of new manufactured homes priced between $125,000 and $250,000 to keep rising.
Manufactured Housing Is Becoming More Appealing to Younger Households
Better affordability makes manufactured housing especially attractive to younger households, first time homebuyers, and millennials struggling to navigate a tight market. Compared with site-built home buyers, manufactured housing buyers have historically skewed older. Although this is still true, data show that the gap has narrowed (table 6). The share of manufactured home borrowers younger than 45 increased 3.6 percentage points from 52.1 percent in 2018 to 55.7 percent in 2021. The same share for site-built housing increased by 1.3 percentage points from 62.4 percent to 63.7 percent over the same period. With site-built housing becoming more expensive and out of reach for middle-class families, more younger households may be opting for manufactured housing. This could also be a sign that historical negative perceptions13 surrounding manufactured housing may be changing.
TABLE 6
Share of Homebuyers Younger Than 45
| Year | Manufactured homes | Site-built homes |
| 2018 | 52.1% | 62.4% |
| 2019 | 52.8% | 62.3% |
| 2020 | 54.8% | 64.3% |
| 2021 | 55.7% | 63.7% |
Source: 2018–21 Home Mortgage Disclosure Act data.
Manufactured homes can be built in various sizes, from single-section units to multisection units. A single-section home can typically range from 700 to 1,400 square feet and is easily transported to the construction site. Multisection units are essentially single-section units that are joined on site but transported separately because of size constraints. Demand for multisection manufactured homes has increased since 2011. In 2011, 26,327 multisection manufactured homes were shipped, or 51.0 percent of total shipments. In 2021, this number rose to 61,017 units and accounted for 57.7 percent of all units shipped. This is consistent with the data presented earlier—that is, a decreasing median manufactured home buyer age, increasing square footage,14 and a rising share of homes priced between $125,000 and $250,000. These findings suggest that younger households and families looking for space are showing greater willingness to buy manufactured housing than was the case historically.
FIGURE 4
Manufactured Home Shipments over Time
Multisection shipments (left axis)
Single-section shipments (left axis)
Multisection share of total shipments (right axis)

URBAN INSTITUTE
Source: US Census Bureau.
Improved Access to Financing Can Boost Demand for Manufactured Housing
Manufactured Home Retail Sales and Financing Overview
Obtaining affordable financing for manufactured home purchases has been and continues to be challenging. These challenges stem in part from the way homes are sold and financed, which is different compared with site-built homes. New and used manufactured homes are sold via retail stores (CFPB 2014). Prospective homebuyers visit a store, select one of the available models, and choose from several financing options listed on the lending board at the retail store. The visit may resemble buying a car from an auto dealership more than buying a site-built home in that the consumer may choose to purchase a new home or a pre-owned one from the sales lot. Sometimes, communities will buy homes directly from manufacturers and sell to borrowers for habitation in that community.
The lenders listed on the lending board are those that have convinced the retailer that they have a reasonable probability of financing the purchase while providing a positive experience to the customer. This gives retailers comfort that the sale will not fall through because of financing or customer service issues.
At the same time, the lending board creates barriers to entry for new or smaller lenders with fewer retailer relationships, which reduces competition. And there is no easy way to get on lending boards because the retail industry is highly fragmented, consisting of thousands of small independent businesses. Manufactured home lending, on the other hand, especially chattel lending, is highly concentrated among a handful of lenders. Eighty-five percent of chattel lending volume in 2021 was originated by the 10 largest lenders by volume compared with 29 percent of manufactured home mortgages. Although homebuyers can shop for financing outside the retailer, most choose from the lending board options. Additionally, there is no guarantee that a lender not on the lending board will do business with the retailer.
Access to Chattel Financing Remains Challenging
Manufactured homes may be titled as either personal property (chattel) or real property. Real property requires the home to be permanently affixed to land owned by the homeowner. In part because manufactured homes are often sold separately from the land on which they are sited, many homeowners title their property as chattel even when they own the land (Russell et al. 2021).
Chattel financing is more expensive than mortgage financing. Loans to finance personal property carry higher interest rates, shorter terms, and fewer consumer protections than loans on homes titled as real property. According to 2021 Home Mortgage Disclosure Act data, the median interest rate on chattel purchase loans was 7.8 percent compared with 3.5 percent on manufactured home mortgages. These higher rates become more cost-prohibitive when combined with the shorter loan term. Table 7 summarizes additional characteristics for chattel loans and manufactured home purchase mortgages originated in 2021.
TABLE 7
Select Purchase Loan Characteristics, 2021
| Chattel loans | Manufactured home mortgages | |
| Originations | $4.9 billion | $15.2 billion |
| Share of borrowers who own land | 28.3% | 99.9% |
| Median term | 20 years | 30 years |
| Median income | $55,000 | $58,000 |
| Median mortgage interest rate | 7.8% | 3.5% |
| Median loan amount | $75,000 | $155,000 |
Source: 2021 Home Mortgage Disclosure Act data.
Interest rates on chattel loans are high for a few reasons. Neither Fannie Mae nor Freddie Mac offers chattel financing, and the FHA’s share of the chattel market is very small. Most chattel loans are financed via private portfolios. Eighty-six percent of chattel purchase lending in 2021 was financed via portfolios or private-label securities. The federally backed share was negligible (table 8). Additionally, chattel loans are secured by only the structure, which depreciates in value over time and exposes lenders to increased risk. Chattel loans are also significantly smaller, requiring lenders to charge more in relation to the loan balance. But the small loan helps keep monthly principal and interest payments low. Affordability is also aided by lower property taxes relative to site-built homes, given the lower purchase price.
The GSEs finance only manufactured homes that are built to HUD standards and titled as real property. Although HUD finances chattel loans, volumes are very small. HUD’s chattel loan limit is $69,678. This is too low for most buyers, given that the average sales price of a new manufactured home without land, transportation, or set-up costs was $108,100 in 2021.
TABLE 8
Chattel Purchase Lending Distribution, by Channel
| Year | GSE | FHA | VA | PLS | Portfolio | Other |
| 2018 | 0.3% | 1.6% | 0.2% | 0.0% | 87.3% | 10.5% |
| 2019 | 0.2% | 0.6% | 0.2% | 2.5% | 84.7% | 11.7% |
| 2020 | 0.2% | 0.5% | 0.1% | 1.7% | 85.8% | 11.6% |
| 2021 | 0.4% | 0.5% | 0.1% | 2.3% | 83.4% | 13.3% |
Source: 2018–21 Home Mortgage Disclosure Act data.
Notes: FHA = Federal Housing Administration; GSE = government-sponsored enterprise; PLS = private-label securities; VA = US
Department of Veterans Affairs. “Other” includes all loans purchased by an entity from the institution outside of the GSEs, Ginnie Mae, private securitizers, commercial banks, savings banks, savings associations, credit unions, mortgage companies, finance companies, life insurance companies, or affiliate institutions (i.e., Farmer Mac).
Compared with chattel purchase lending, the channel distribution of manufactured home purchase mortgages is much more uniform. In 2021, the GSE share of manufactured home purchase mortgages was 24.2 percent, compared with the FHA share of 34.4 percent and portfolio share of 30.1 percent.
Overall, 67 percent of purchase lending was federally backed.
TABLE 9
Manufactured Housing Mortgage Purchase Distribution, by Channel
| Year | GSE | FHA | VA | PLS | Portfolio | Other |
| 2018 | 19.0% | 35.7% | 10.1% | 0.4% | 32.7% | 2.1% |
| 2019 | 18.3% | 36.6% | 10.8% | 0.9% | 31.1% | 2.4% |
| 2020 | 21.1% | 34.0% | 9.3% | 0.5% | 32.8% | 2.3% |
| 2021 | 24.2% | 34.4% | 8.7% | 0.2% | 30.1% | 2.3% |
Source: 2018–21 Home Mortgage Disclosure Act data.
Notes: FHA = Federal Housing Administration; GSE = government-sponsored enterprise; PLS = private-label securities; VA = US
Department of Veterans Affairs. “Other” includes all loans purchased by an entity from the institution outside of the GSEs, Ginnie Mae, private securitizers, commercial banks, savings banks, savings associations, credit unions, mortgage companies, finance companies, life insurance companies, or affiliate institutions (i.e., Farmer Mac).
The Federal Government Can Play a Bigger Role in the Chattel Financing Market
There are a few ways we can improve chattel financing to better serve borrower needs. HUD should increase chattel loan limits to reflect market prices and should institute a process for annual increases in line with home price appreciation. This increase would ensure loan limits reflect market prices.
Second, we should reduce costs wherever we can. According to data provided by Cascade Financial,
FHA requirements for inspection, foundation, termite pretreatment, and final survey can add more than $11,000 to a home’s purchase price. For private loans, these services cost $4,800.15 The extra cost is added to the loan amount and increases the monthly payment.
There are only a handful of FHA chattel lenders, as Ginnie Mae requires issuers to have a minimum net worth of $10 million plus 10 percent of outstanding obligations to participate in its manufactured housing program. For its single-family program, these requirements are $2.5 million plus 0.35 percent of outstanding obligations. As a result, many small lenders find it uneconomical to offer manufactured housing financing or must do so at higher interest rates.
Availability and affordability of chattel financing would be further improved if the GSEs entered this space. A GSE-backed chattel product would provide incentives for more lenders to offer financing and at better terms. Although chattel loans are riskier than manufactured home mortgages, the GSEs could structure pilot programs to acquire chattel loans and lay off some of the risk to the private markets (Brickman 2022). To make a meaningful contribution, however, this program must be scalable, which requires standardization and transparency. The GSEs would need to establish credit and servicing policies for chattel loans and monitor lending activity on an ongoing basis to ensure it is done safely. Chattel financing is riskier, but one can contemplate a GSE-backed product with an interest rate somewhere between current chattel rates and manufactured housing mortgage rates.
There is private market precedent for securitizing chattel loans. In 2021, $135 million in chattel originations were financed through private-label securities, representing 2.4 percent of total chattel originations of $5.7 billion. Experience from these private-label securities transactions indicates that investors have appetite for this risk. Moreover, deal performance remains strong. According to data provided by Cascade Financial Services for its CMAT 2019-MH1 transaction, only 0.91 percent of outstanding loans as of March 2022 were 90 or more days delinquent (excluding foreclosures) and 2.47 percent were in foreclosure. Underlying loans were originated from 2017 to 2019, and 70 percent of the origination loan balance was chattel. The average credit score was 627, the average loan-to-value ratio was 92 percent, and the average debt-to-income ratio was 38.2 percent. The average loan amount was $86,000, and the average purchase price was $89,000.
A key appeal to investors is that loans backed by manufactured homes, both mortgages and chattel loans, are less sensitive to interest rate changes compared with loans for site-built homes.16 When rates fall, manufactured home prepayment speeds do not rise dramatically. This is a real advantage, as investors are not forced to reinvest a surge of cash flows at lower rates. The slower prepayment speeds are a function of three factors: weaker borrower credit profiles, smaller loan balances, and, for chattel financing, the lack of a competitive refinance marketplace.
FIGURE 5
Prepayment Speeds Comparison

Sources: Cascade Financial Services and Credit Suisse.
Figure 5 shows one-month total conditional prepayment rates for the Ginnie Mae II 4.0 coupon, the Cascade-issued Ginnie Mae 4.0 specified pool, and Cascade’s MH Asset Trust 2019-MH1 securitization. The latter two are backed entirely by manufactured home loans. Manufactured home loans have exhibited significantly slower prepayment speeds than the broader Ginnie Mae market. Ginnie Mae II speeds were higher even before the pandemic and escalated further during the pandemic as interest rates fell. In comparison, speeds for the specified pool were muted before the pandemic and exhibited a smaller increase during the pandemic, as did the Cascade non-agency pool.
Borrowers have very limited opportunity to refinance chattel loans. The refinance share of chattel originations has been persistently low, staying under 10 percent since 2018, and significantly lags the refinance shares for mortgages on site-built or manufactured homes (figure 6). In 2021, one of the best times to refinance in a generation, the refinance share of originations in the site-built market was 61.2 percent, compared with 43.4 percent for manufactured home mortgages and just 7.5 percent for chattel loans.
FIGURE 6
Refinance Shares of Originations, by Product

URBAN INSTITUTE
Source: 2018–21 Home Mortgage Disclosure Act data.
Improvements to Manufactured Housing Mortgage Financing
Although manufactured home mortgage financing is cheaper than chattel, there is room for improvement. Although land purchase is a separate transaction from buying a manufactured housing unit, financing for the two is linked. Unlike site-built homes, manufactured home mortgage financing is typically disbursed in stages: the first draw covers land purchase, the second pays for land improvement, and the final draw (when the construction loan is converted to permanent financing) is made when the home is installed. Lenders must remain involved throughout this process and work with the retailer or the manufacturer to resolve any issues. Frictions along the way can delay the project. For GSE manufactured home mortgages, income, employment, credit, and appraisal documentation must generally be no more than four months old at closing. If the project takes longer, the borrower must be underwritten again. The GSEs also generally charge a 50 basis-point loan-level pricing adjustment for manufactured housing mortgages. Reducing these costs and process frictions can make the product more affordable.
How Many Manufactured Housing Units Could We Add to the Housing Supply?
The severe shortage of affordable site-built homes is likely to fuel demand for cheaper alternatives in the years ahead. This will provide the manufactured housing industry incentives to respond by raising production. Suggested improvements to chattel financing could improve credit availability and boost demand. Given the current low level of shipments by historical standards, significant room exists to increase production. Between 1976, when the new HUD manufactured housing code when into effect, and 1994, when the market began to overheat, 240,000 manufactured homes were shipped per year, on average; in recent years, this number has averaged about 100,000 homes. Increasing annual production to 170,000 homes (halfway between 100,000 and 240,000) in the face of a larger population and the fact that manufactured housing is now a much-improved product is an achievable target. The additional 70,000 homes created per year would add 700,000 new units to the housing stock over a decade.
A simple forecast can illustrate why this outcome is reasonable (table 10). In 2021, 105,800 new manufactured homes were shipped, 12 percent more than in 2020. January to April 2022 shipments are running around 12 percent higher compared with the same period from 2021 as demand remains strong. This trend is likely to accelerate during 2022 as new production facilities come online. But even at 12 percent annual growth, full-year 2022 shipments would total around 118,000. If we assume a 10 percent shipment increase in 2023 and 2024 and 7 percent in 2025 and 2026, the industry would produce close to 165,000 units in 2026. Additionally, if the right set of policies were put in place (i.e., zoning reforms to encourage more manufactured housing, as well as improvements to chattel financing), this number could be even higher. Most importantly, all these units would be created in the affordable segment of the market, mitigating the rising housing cost burdens low- and moderateincome households face.
TABLE 10
Estimated Manufactured Housing Shipments and Purchase Lending Volumes
| 2021 actual | 2022 | 2023 | 2024 | 2025 | 2026 | |
| Total manufactured housing home sales | N/A | 354,741 | 390,215 | 429,237 | 459,283 | 491,433 |
| New shipments | 105,800 | 118,247 | 130,072 | 143,079 | 153,094 | 163,811 |
| Existing sales | N/A | 236,494 | 260,144 | 286,158 | 306,189 | 327,622 |
| New units financed | N/A | 87,171 | 95,888 | 105,477 | 112,861 | 120,761 |
| Existing units financed | N/A | 72,650 | 79,915 | 87,907 | 94,060 | 100,644 |
| Average manufactured housing purchase loan | $141,448 | $162,665 | $178,932 | $189,667 | $201,048 | $213,110 |
| Estimated total purchase volume (billions) | $20.10 | $25.99 | $31.46 | $36.68 | $41.60 | $47.18 |
Source: Urban Institute forecast. Note: N/A = not applicable.
Increased annual shipments would also help purchase originations increase and aid further development of the manufactured home lending market. As origination volumes rise, traditional mortgage lenders might enter this market, increasing competition and offering better borrower terms. Over time, improved access to credit would make it easier for households to purchase manufactured housing, including resale units, which are more likely to be purchased for cash currently.17 To estimate purchase volumes, we assume 15 percent annual home price appreciation in 2022 (down from 23 percent in 2021 in the wake of higher interest rates), 10 percent in 2023, and 6 percent thereafter. Strong home price appreciation is likely to continue, given the demand and the high costs of building materials and labor amid high inflation. In this forecast, we assume a financing share of 70 percent for new shipments and 27 percent for resale units using data from the Texas Department of Housing and Community Affairs.
Based on these assumptions, we estimate annual purchase originations will reach $47 billion by 2026. This is more than double the $20.1 billion in 2021. As discussed earlier, the refinance market for chattel loans is miniscule today, given low competition and the lack of federally backed financing. With proper reforms in place, refinance volumes, which are excluded from the above estimates, could also increase.
Conclusion
The housing supply crisis is a collection of multiple problems with various underlying causes ranging from stringent zoning and building code requirements, a shortage of construction labor, the high costs of materials, and financing difficulties for low-cost housing. There is no silver bullet; each problem needs to be addressed individually. In this report, we have highlighted the role of manufactured housing from a historical perspective and explained the role it can play in the future with the right set of policy and market interventions.
The deficit of housing inventory and unaffordable prices, growing demand for low-price housing, and improved consumer willingness to own manufactured housing strongly suggest that manufactured housing can be an important component of a broader solution. Manufactured housing composes a small share of housing production, accounting for just 9 percent of single-family starts in 2021, but it plays a dominant role in the low-price segment of the market. New site-built production in this segment is largely nonexistent, and affordability constraints are especially acute. With the right mix of zoning reforms and financing improvements, meaningful supply of manufactured homes can be added to the affordable housing supply in the coming years.
Notes
- About 91 percent of the single-family housing stock, or 85.6 million out of 93.8 million units, are detached structures.
- California and Oregon now permit accessory dwelling units in single-family zones as a matter of right. Minneapolis, Minnesota; Seattle, Washington; Austin, Texas; Burlington, Vermont; and other cities allow accessory dwelling units in single-family zones
- White House, “Fact Sheet: Biden-Harris Administration Announces Immediate Steps to Increase Affordable Housing Supply,” press release, September 1, 2021, https://www.whitehouse.gov/briefing–room/statementsreleases/2021/09/01/fact–sheet–biden–harris–administration–announces–immediate–steps–to–increaseaffordable–housing–supply/.
- White House, “President Biden Announces New Actions to Ease the Burdens of Housing Costs,” press release, May 16, 2022, https://www.whitehouse.gov/briefing–room/statements–releases/2022/05/16/president–bidenannounces–new–actions–to–ease–the–burden–of–housing–costs/.
- Cavco, “Cavco Industries Announces Acquisition of Manufacturing Facility in North Carolina, Expanding Affordable Home Production Capabilities,” news release, February 28, 2022, https://www.cavco.com/cavcoindustries–announces–acquisition–of–manufacturing–facility–in–north–carolina/; and Skyline Champion, “Skyline Champion Opening Two-Plant Campus Creating over 250 Jobs,” press release, November 10, 2021, https://ir.skylinechampion.com/press–releases/press–release–details/2021/Skyline–Champion–Opening–TwoPlant–Campus–Creating–Over–250–Jobs/default.aspx.
- Office of Policy Development and Research (PD&R), “HUD Standards for Manufactured Housing,” US Department of Housing and Urban Development, PD&R, accessed June 14, 2022, https://www.huduser.gov/portal/periodicals/em/WinterSpring20/highlight1–html.
- PD&R, “HUD Standards for Manufactured Housing.”
- PD&R, “Effects of Market Forces on the Adoption of Factory-Built Housing,” US Department of Housing and Urban Development, PD&R, accessed June 14, 2022, https://www.huduser.gov/portal/periodicals/em/WinterSpring20/highlight2.html.
- In 2015, the AHS implemented a major survey and methodology redesign. This makes AHS estimates for 2015 and later years noncomparable with previous years.
- “Energy Star Manufactured New Homes,” Energy Star, accessed June 14, 2022, https://www.energystar.gov/newhomes/energy_star_manufactured_homes.
- US Department of Energy, “DOE Updates Mobile Home Efficiency Standards to Lower Household Energy Bills,” press release, May 18, 2022, https://www.energy.gov/articles/doe–updates–mobile–home–efficiency–standardslower–household–energy–bills.
- The average sales price for new site-built homes (including land) in 2021 was $464,200, and the derived average land price was $98,296, according to the Survey of Construction.
- Rob Wirtz, “Home, Sweet (Manufactured?) Home,” Federal Reserve Bank of Minneapolis, July 1, 2005, https://www.minneapolisfed.org/article/2005/home–sweet–manufactured–home.
- The average size of new manufactured homes has increased from 1,438 square feet in 2014 to 1,497 square feet in 2021, while the average size of new site-built homes has declined from 2,707 to 2,544 square feet during this period.
| 22 | NOTES |
Costs stated are based on recent loan transactions. Future costs may differ based upon such factors and circumstances as changes in labor and material costs, the home type and its location, and the contractor used.
- Laurie Goodman and Michael Neal, “It’s Difficult for Manufactured Home Borrowers to Reap the Benefits of Historically Low Interest Rates,” Urban Wire (blog), Urban Institute, September 17, 2021,
https://www.urban.org/urban–wire/its–difficult–manufactured–home–borrowers–reap–benefits–historically–lowinterest–rates.
- In Texas, 73.6 percent of existing manufactured homes titled in 2021 were purchased for cash compared with 30.3 percent of newly shipped homes.
| NOTES | 23 |
References
Aw, Astou, Lariece Brown, and Ashley Yea. n.d. Identifying the Opportunities to Expand Manufactured Housing. McLean, VA: Freddie Mac.
Brickman, David. 2022. “Credit Risk Transfers as a Catalyst for Affordable Housing Initiatives.” Washington, DC: Urban Institute.
CFPB (Consumer Financial Protection Bureau). 2014. Manufactured–Housing Consumer Finance in the United States. Washington, DC: CFPB.
Committee on Banking (Senate Committee on Banking, Housing, and Urban Affairs). 2000. “Manufactured Housing Improvement Act of 2000.” Washington, DC: Government Printing Office.
Goodman, Laurie S., Karan Kaul, and Michael Neal. 2022. “Improvements in Financing Could Increase the Single Family Affordable Housing Supply.” Journal of Structured Finance 28 (1): 38–47. https://doi.org/10.3905/jsf.2022.1.132.
Goswami, Ashok. 2005. An Assessment of Damage to Manufactured Homes Caused by Hurricane Charley. Herndon, VA: Institute for Building Technology and Safety.
Kaul, Karan, Laurie Goodman, and Michael Neal. 2021. “The Role of Single–Family Housing Production and Preservation in Addressing the Affordable Housing Supply Shortage.” Washington, DC: Urban Institute.
Khater, Sam, Len Kiefer, and Venkataramana Yanamandra. 2021. “Housing Supply: A Growing Deficit.” McLean, VA: Freddie Mac.
Rosen, Kenneth T., David Bank, Max Hall, Scott Reed, and Carson Goldman. 2021. “Housing Is Critical Infrastructure: Social and Economic Benefits of Building More Housing.” Berkeley, CA: Rosen Consulting Group.
Russell, Jessica, Nora O’Reilly, Karl Schneider, Nicolas Melton, Nick Schwartz, and Sam Leitner. 2021. Manufactured Housing Finance: New Insights from the Home Mortgage Disclosure Act Data. Washington, DC: Consumer Financial Protection Bureau.
| 24 | REFERENCES |
About the Authors
Karan Kaul is a principal research associate in the Housing Finance Policy Center at the Urban Institute. He publishes innovative, data-driven research on complex, high-impact policy issues to improve the US mortgage finance system. A strategic thinker and thought leader with 13 years of experience in mortgage capital markets, Kaul has published more than 100 research articles on such topics as the housing supply crisis, mortgage servicing reforms, efficient access to credit, benefits of alternative credit scoring, industry safety and soundness, and institutional single-family rentals. He has advocated for efficient industry practices, regulation, and legislation to make the mortgage market work better for all Americans. At Urban, Kaul has led the Mortgage Servicing Collaborative and the Mortgage Markets COVID-19 Collaborative. He speaks frequently with members of the media and presents at housing conferences. Before joining Urban, he spent five years at Freddie Mac as a senior strategist analyzing the business impact of postcrisis regulatory reforms. Kaul holds a bachelor’s degree in electrical engineering and a master’s degree in business administration from the University of Maryland, College Park.
Daniel Pang is a research assistant in the Housing Finance Policy Center. Before joining Urban, he interned in the US Senate and the American Civil Liberties Union of Missouri. Pang graduated magna cum laude from Washington University in Saint Louis with BAs in economics and political science, where his research focused on a hedonic price comparison of manufactured and site-built homes in the US.
| ABOUT THE AUTHORS | 25 |
STATEMENT OF INDEPENDENCE
The Urban Institute strives to meet the highest standards of integrity and quality in its research and analyses and in the evidence-based policy recommendations offered by its researchers and experts. We believe that operating consistent with the values of independence, rigor, and transparency is essential to maintaining those standards. As an organization, the Urban Institute does not take positions on issues, but it does empower and support its experts in sharing their own evidence-based views and policy recommendations that have been shaped by scholarship. Funders do not determine our research findings or the insights and recommendations of our experts. Urban scholars and experts are expected to be objective and follow the evidence wherever it may lead.
Additional Information with more MHLivingNews Expert Analysis and Commentary
The bulk of what UI authors Karan Kaul and Daniel Pang said in their report above is useful and largely supported by empirical evidence, as they themselves noted. For instance, though they failed to reference the seminal – and in some ways, similar – research performed in 2018 by the National Association of Realtors Certified Business Economist (CBE) Scholastica “Gay” Cororaton, they make several similar points to hers. One example of that is found below.

Additionally, while not mentioning the research performed by LendingTree that once-more reaffirmed the fact that manufactured homes appreciate, Kaul and Pang both mentioned appreciation several times.
Kaul and Pang have forged an evidence-based case why more manufactured homes ought to be sold and have outlined reasons which are limiting manufactured housing. Those reason, while not mentioning the Manufactured Housing Association for Regulatory Reform (MHARR) by name, mirror years of statements and findings by MHARR on the subject of how zoning/placement and financing are two of the keys that are limiting manufactured housing production.
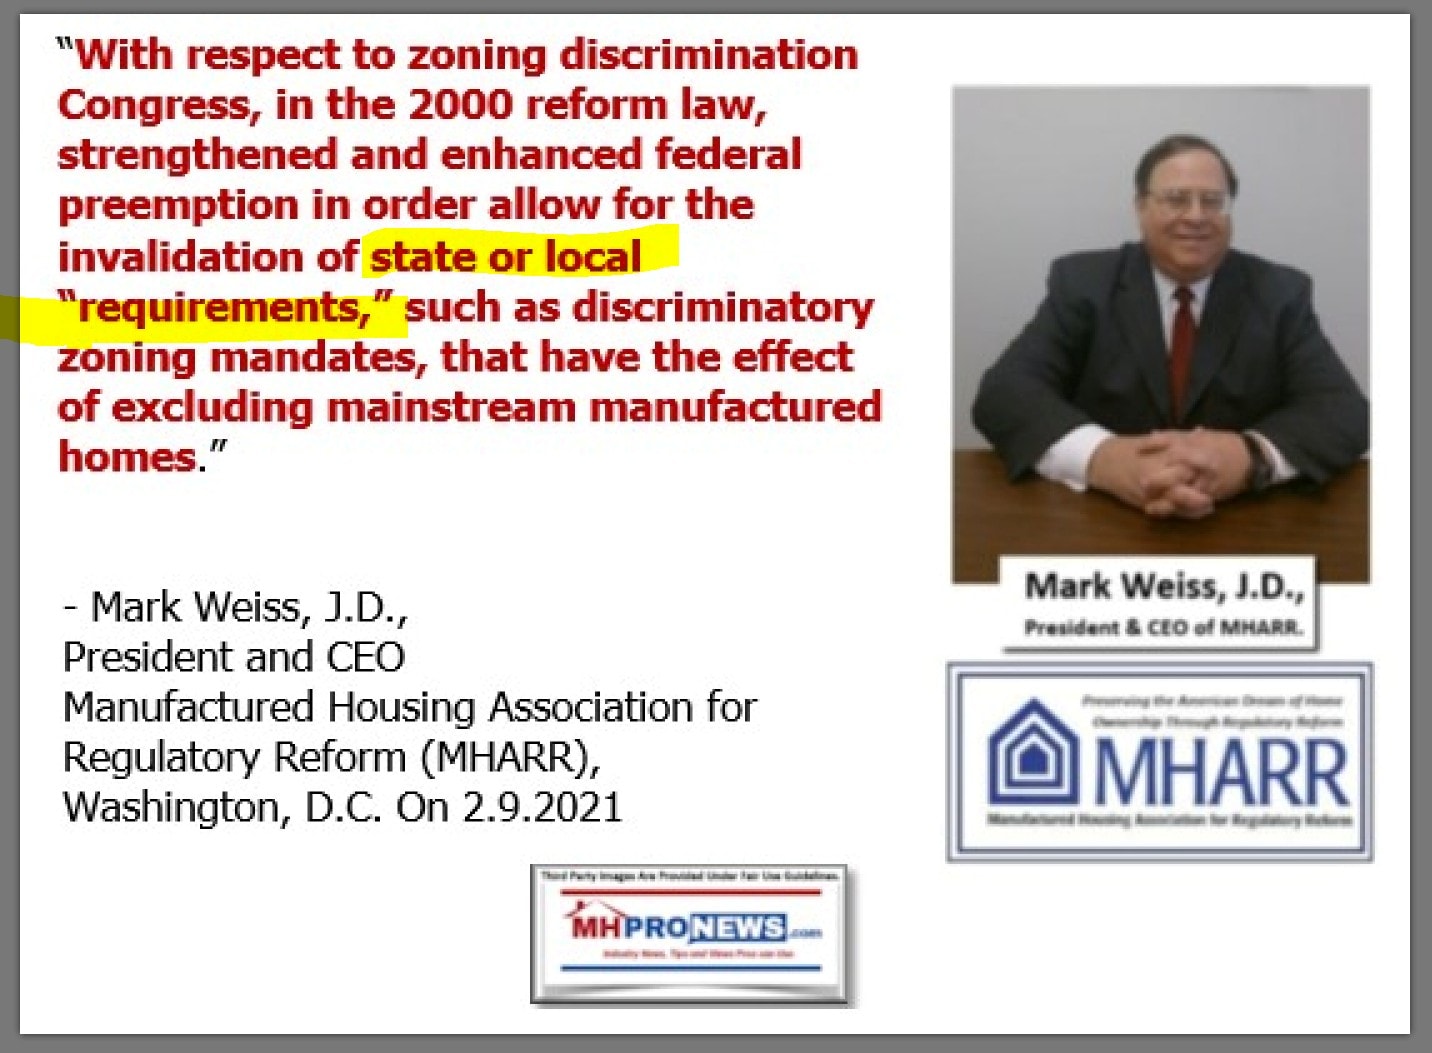

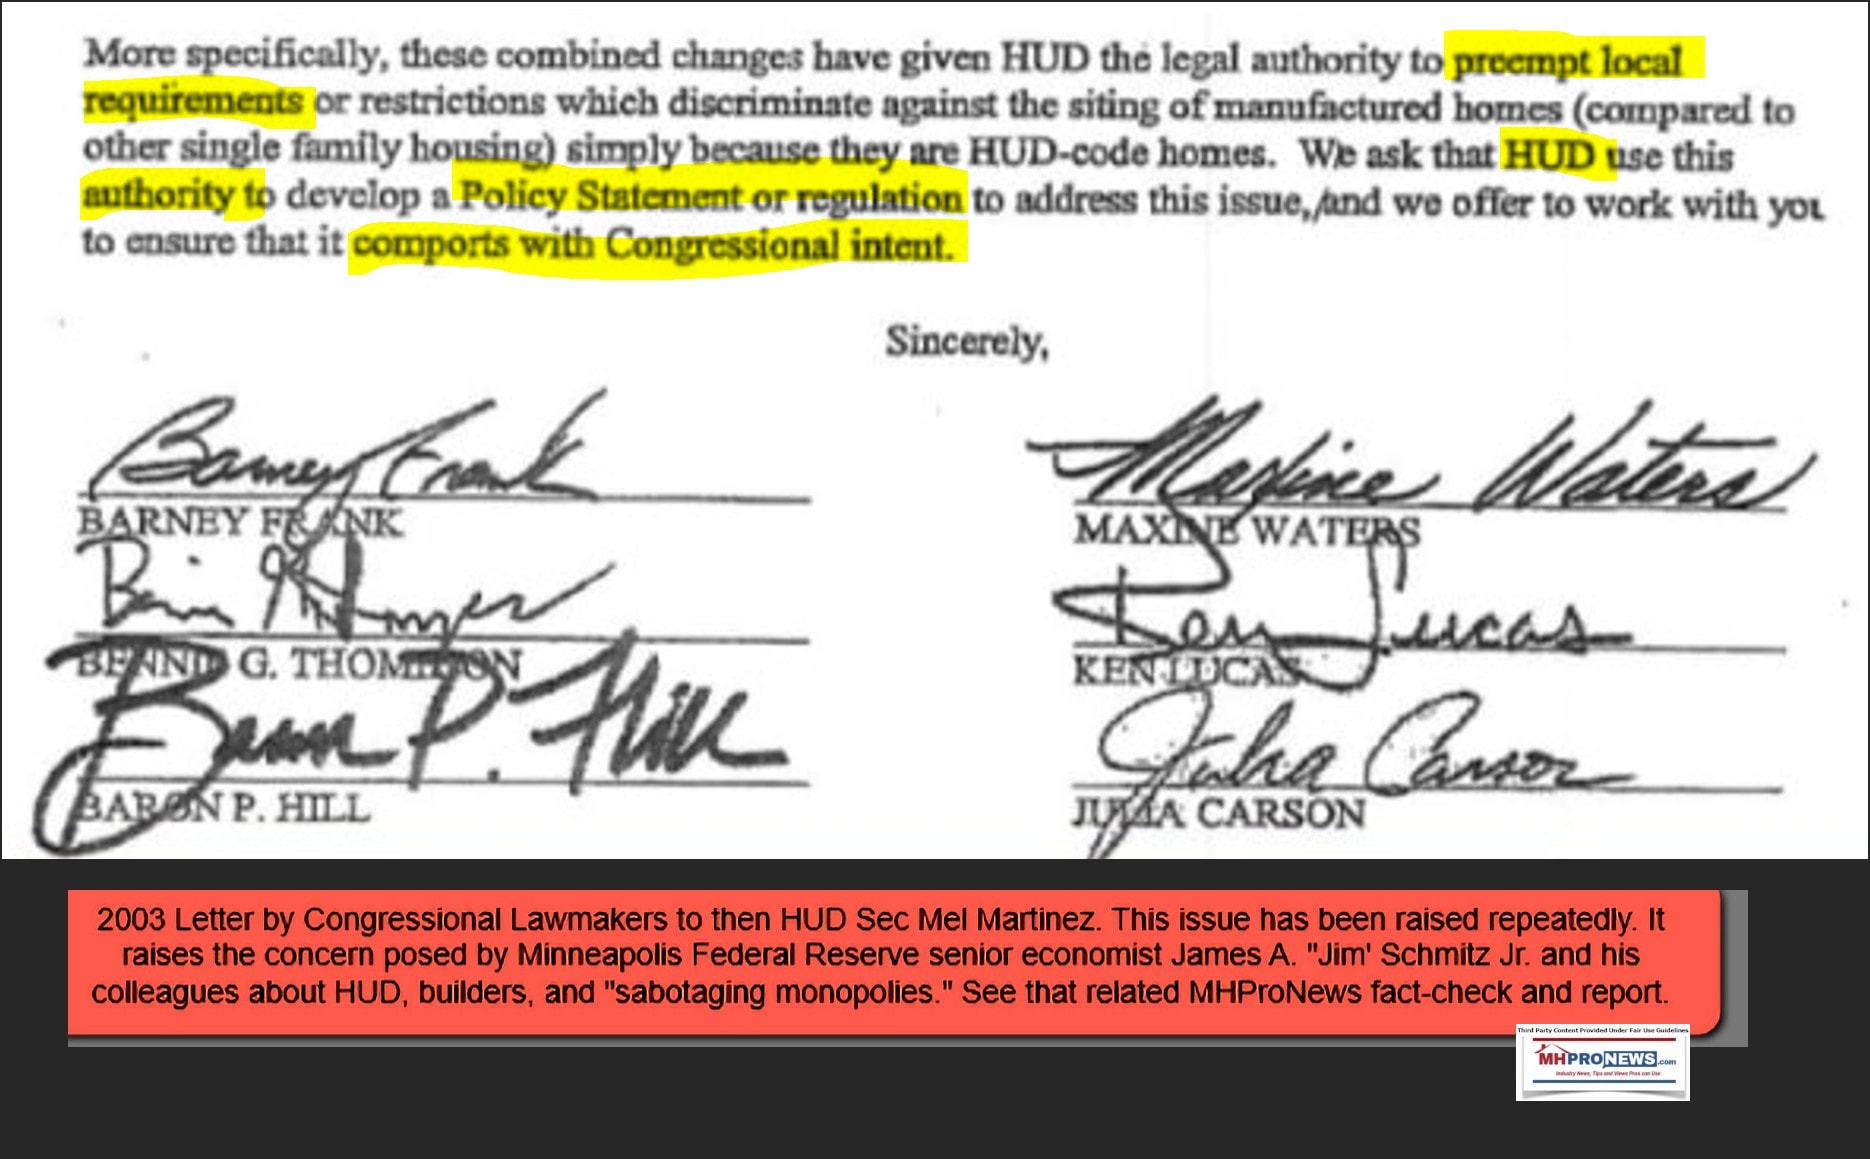
Put differently, one could go line by line, point by point on various pieces of evidence that UI researchers Kaul and Pang have made the case why more manufactured homes could and should be sold as part of the solution to the growing affordable housing crisis.
What they do not say or do, however, is arguably every bit as important as what they did.
Before diving into that statement, the point should be made that research like that theirs above is found on MHLivingNews and on our MHProNews sister site extensively. It is not, however, found on the MHI website, which claims to be representing “all segments” of the manufactured housing and factory-built home industries. By accident and/or design, that raises the question. Did Kaul and Pang dodge some of the key issues that are undermining the industry from within? The answer doesn’t change the overall value of their thesis. But it does suggest that despite disclaimers, they may be influenced to some degree by the source of their funding. To be polite, an evidence-based case can be made that Cascade is not known for publicly bucking MHI. But over time, several past and present MHI members have done precisely that – question MHI’s effectiveness as a trade group.
But before ‘going there’ on MHI or UI, there are also some factual weaknesses in their overall useful thesis. A few examples will illustrate that claim.
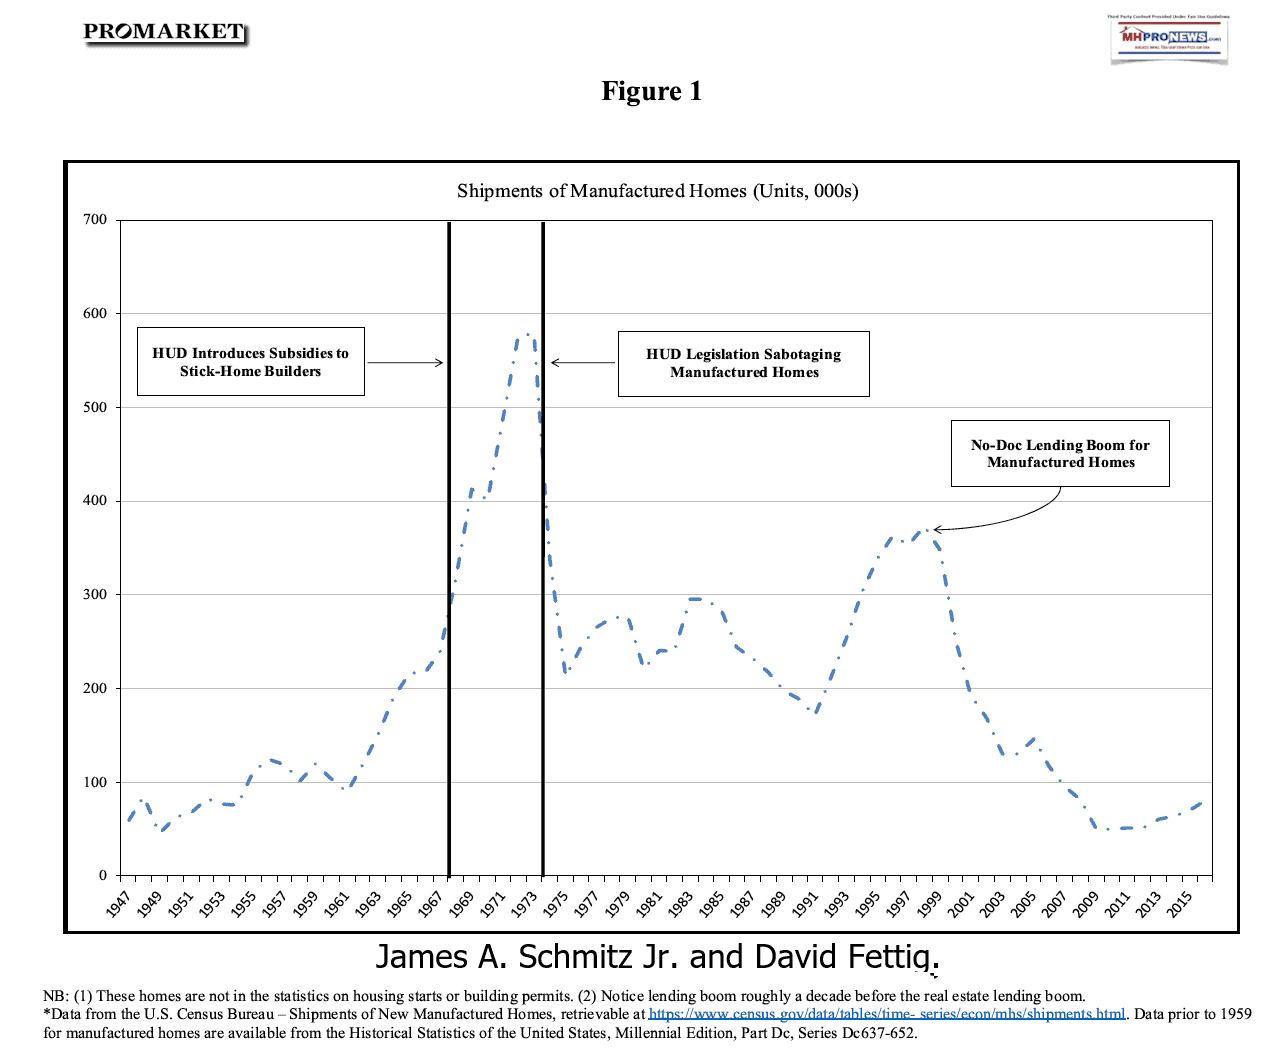
Above their figure 2, Kaul and Pang claimed that the peak production for HUD Code manufactured homes achieved in the 1990s was “unsustainable.” Says who, based on what evidence? Here is what they said above: “From 1994 to 2000, the number of manufactured housing units increased to more than 300,000 per year, an unsustainable level caused by overproduction and loosening financing standards, which resulted in credit being extended to borrowers who could not afford the homes.” Their statement is a logical non sequitur. By way of analogy, the fact that conventional housing had a mortgage/finance bubble that was partially a result of ‘no doc’ or ‘liar loans’ that burst in the 2008 housing/financial crisis doesn’t prove that the housing construction levels during those years was ‘unsustainable.’ More to the point, given that pre-HUD Code mobile homes achieved sales levels far higher than the post-HUD Code period, one must think that with a larger population, a proportionately similar level of production could be achieved.
The graphic above makes that point, which was also made by James A. “Jim” Schmitz, Jr. and his Minneapolis Federal Reserve researchers and other economic expert colleagues.
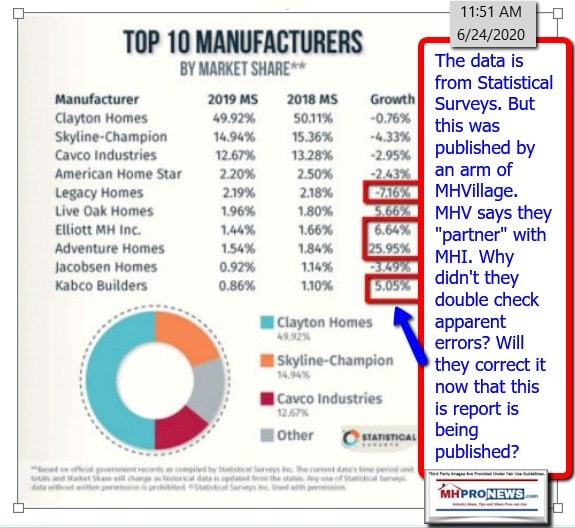
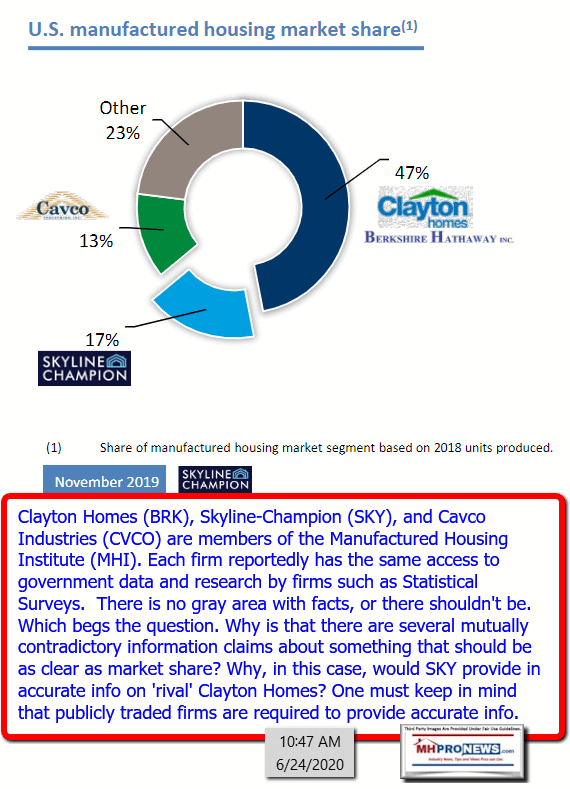
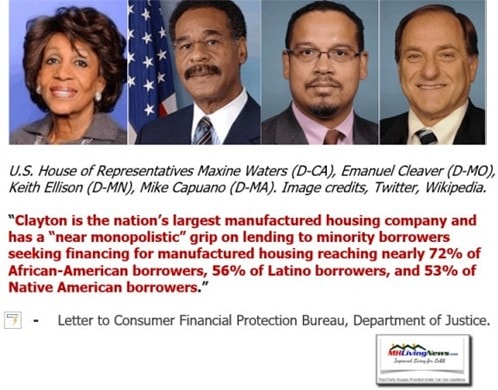
As another example of a possible factual glitch above in the UI report, there are reasons to question Table 1 by Kaul and Pang. MHI connected firms have previously misstated market share, and there is evidence that they have cited information that may have done so again. That said, market share data is hardly an issue that should keep a possible manufactured home shopper from buying. It is, however, arguably a reason to question some of the sources and motivations of MHI and some of their dominating member firms.
The U.S. population in 1975 was some 211,274,535, per MacroTrends. Per that same source, U.S. population in 2021 was 336,997,624. So, the population grew by 159.5%. Extrapolating from the 1975 mobile home production data that suggests that if a similar level of production was achieved in now as then, then HUD Code manufactured housing ought to be producing some 909,150 new manufactured homes annually.

In fairness to Kaul and Pang, they have done the industry’s truth-seeking professionals and advocates a favor with respect to MHI connected data. MHProNews/MHLivingNews. The example below is but on instance. MHI for years has understated the value of manufactured housing production by billions of dollars annually. UI’s report by Kaul and Pang made that clear, compare their data above with the MHI visual below.

Perhaps, by raising this point, MHI might correct that error in the future?
While not quite precise, using the Census figures in December 2021 multiplied by the total shipments for the year, would yield the following figures. 105772 X 123200 = $13,031,110,400. This would make MHI’s data too low, and may suggest that UI’s researchers figures might be too high.
Summing Up and Conclusion
Manufactured housing is the most affordable permanent housing option in the U.S.A. today. It is, as MHLivingNews has previously reported – and UI confirmed above – about half the cost per square foot as conventional housing. The quality of manufactured homes is significantly superior to many pre-HUD Code mobile homes. Kaul and Pang aptly make the point that the terminology matters, because a mobile home and manufactured home are distinctive. They were each built to different construction standards.
Kaul and Pang are correct in saying that zoning/placement issues and financing issues are two of the biggest hurdles slowing down the manufactured home industry. That said, they failed to point out the controversies that are quite well known from inside the world of manufactured housing, some of which is exemplified herein and further detailed in linked reports.
From a consumer’s perspective, they should be seeking accurate information and carefully shopping for ‘white hat’ professionals. As in any other profession, there are ‘bad actors’ as well as good ones in manufactured housing.
For all in the housing market, a healthy manufactured home market is necessary for housing market stability. If the conventional housing market destabilizes later this year or next, as some observers have warned may happen, part of the reason will be because not enough manufactured homes are being sold. No less a figure than prior HUD Secretary Ben Carson explained why.

So, in conclusion, Kaul and Pang have added to the body of evidence in favor of modern manufactured homes being more extensively used and being widely needed. That said, one will hope that they will correct and re-issue their research report, as did Scholastica “Gay” Cororaton when the factual errors in her research were pointed out. The NAR’s publication and Cororaton swiftly made those corrections and removed the errant copy from their website. That’s what might be the standard for Kaul, Pang, UI and MHI to aim for in their own work. See the video interview with realtor Linda Hazelhoff, whose spouse is a custom builder, share her experience and expert insights in the video posted below on the topic of modern manufactured homes to learn more. ##



That’s a wrap on this installment of “News through the lens of manufactured homes and factory-built housing” © where “We Provide, You Decide.” © ## (Affordable housing, manufactured homes, reports, fact-checks, analysis, and commentary. Third-party images or content are provided under fair use guidelines for media.) (See Related Reports, further below. Text/image boxes often are hot-linked to other reports that can be access by clicking on them.)

By L.A. “Tony” Kovach – for MHLivingNews.com.
Tony earned a journalism scholarship and earned numerous awards in history and in manufactured housing. For example, he earned the prestigious Lottinville Award in history from the University of Oklahoma, where he studied history and business management. He’s a managing member and co-founder of LifeStyle Factory Homes, LLC, the parent company to MHProNews, and MHLivingNews.com. This article reflects the LLC’s and/or the writer’s position, and may or may not reflect the views of sponsors or supporters.
Connect on LinkedIn: http://www.linkedin.com/in/latonykovach
Recent and Related Reports:
The text/image boxes below are linked to other reports, which can be accessed by clicking on them.
Celebrities, Millionaires, Billionaires and Their Appealing Manufactured Homes
Lifestyles of the Rich and Frugal: Manufactured Mansions Take Their Place in the California Sun
 manufacturedhomelivingnews.com Manufactured Home Living News


